
Page 30 - Delaware Medical Journal - January/February 2019
P. 30
.0001). Not having a personal doctor was also associated with a lower prevalence of HPV vaccination (37.5%, p<.0001).
Completion of HPV vaccination among females 18-29 years
Of the females in the 18-29-year age group receiving at least one dose of HPV vaccination, 60.1% completed the HPV vaccination shot series. Significant differences in HPV completion were found by race, MSA status, marital status, education, income, insurance, and having a personal doctor (Table 3). By race, the prevalence of HPV completion was significantly lower among blacks (37.2%) and Hispanics (39.9%) as compared to white females (71%,
p<.0001). HPV completion was lower among females living in non-MSA areas (50.3%, p=.0041), women who were single (40.1%, p=.0074), women with a lower income (51.2%, p<.0001), and uninsured women (42.1%, p<.0001). Not having a personal doctor was also associated with a lower HPV completion prevalence (45.7%, p<.001).
Initiation of HPV vaccination among males 18-29 years
For the combined data (2013-2016), 8,258 men answered HPV vaccination questions. Overall, 1,107 (15.4 %) men ever had an HPV vaccination. There ���� ���������� ����������� �� ��� initiation by marital status, insurance, having a personal doctor, and having
received an HIV test (Table 3). HPV ����������� ��� ������������ ����� among men living in non-MSA areas (11.9%, p=.03), men who were single (11.5%) or in a (married or other) couple relationship (9.2%, p<.0001), men who had not received an HIV test (13.9
%, p=.001), and uninsured men (10.6 %, p=.0001). Not having a personal doctor was also associated with a lower prevalence of HPV vaccination (11.5%, p<.0001).
Completion of HPV vaccination among males 18-29 years
Of the males in the 18-29-year age group receiving at least one dose of HPV vaccination, 30.6% completed the ��� ����������� ���� ������� ����������
23.8 (21.8-25.7)
13.5 (11.2-15.9)* 39.4 (35.9-43.0)
29.6 (26.9-32.3)
31.2 (25.0-37.5)*
20.8 (16.1-25.6) 24.6 (18.6-30.7)
34.3 (30.4-38.1) 22.0 (19.3-24.7)
28.6 (25.9-31.1835) 22.2 (18.2-26.1)
Male Female
White NH
Black NH
Hispanic
Other, including multiracial
Yes No
Unmarried Couple
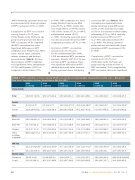
TABLE 2. HPV vaccination (≥ 1 dose) among 18-29 years old, by socio-demographic characteristics and by year — Behavioral Risk Factor Surveillance System, United States, 2011 to 2016
Characteristic
2011
% (95%CI)
2012
% (95%CI)
22.8 (20.6-24.9)
2013
% (95%CI)
2014
% (95%CI)
32.5 (30.4-34.6) *
2015
% (95%CI)
2016
% (95%CI)
Total
16.8 (13.7-20.0)
18.6 (17.0-20.1)
29.0 (26.8-31.3)
28.0 (26.3-29.6)
32.1 (29.6-34.6)
Gender
4.4 (2.1-6.7)*
5.5 (4.3-6.7)*
14.6 (11.6-17.5)*
15.9 (13.6-18.2)*
19.2 (16-22.5)*
32.8 (26.6-39.0)
35.3 (32.4-38.3)
49.4 (45.9-52.8)
45.3 (42.7-47.9)
51.4 (47.4-55.4)
Race
19.0 (14.8-23.1)
35.3 (31.9-38.7)*
38.0 (34.8-41.1)
15.3 (6.5-24.1)
19.9 (14.8-25.1)
23.2 (17.6-28.9)
30.1 (24.8-35.4)
29.9 (22.6-37.1)
14.4 (5.7 23.2)
17.0 (13.4-20.6)
29.9 (23.7-36.1)
23.4 (17.9-28.8)
36.2 (25.9-46.5)
Data suppressed
18.9 (13.9-23.9)
25.1 (19.7-30.4)
22.8 (17.9-27.7)
40.4 (30.6-50.3)
HIV Test
23.2 (17.0-29.4)*
23.8 (21.1-26.6)*
35.7 (32.1-39.3)*
34.1 (31.1-37.1)*
40.6 (36.1-45.2)*
14.2 (10.3-18.1)
18.6 (16.5-20.6)
28.6 (25.3-31.9)
28.1 (25.9-30.4)
32.6 (29.2-36.)
Marital Status
20 (16 -24.1)
23 (20.9-25.1)*
33.8 (31-36.7)
33.5 (31.3-35.7)
39.6 (36.1-43.1)
13.2 (6.3-20.1)
16.1 (13.3-18.8)
25.2 (20.7-29.6)
23.9 (20.9-26.9)
29.2 (24.7-33.7)
30
Del Med J | January/February 2019 | Vol. 91 | No. 1
