
Page 29 - Delaware Medical Journal - January/February 2019
P. 29
ORIGINAL RESEARCH
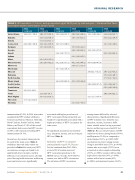
TABLE 1. HPV vaccination (≥ 1 dose ) among respondents aged 18-29 years, by state and year — Behavioral Risk Factor Surveillance System, United States, 2011 to 2016
2011
% (95%CI)
2012
% (95%CI)
2013
% (95%CI)
2014
% (95%CI)
2015
% (95%CI)
2016
% (95%CI)
United States
16.8 (13.7-20.0)
18.6 (17.0-20.1)
29.0 (26.8-31.3)
28.0 (26.3-29.6)
32.1 (29.6-34.6)
23.8 (21.8-25.7)
Alabama
15.0 (11.8-18.1)
19.5 (15.9-23.2)
26.0 (22.1-29.9)
Arizona
17.8 (13.8-21.7)
Connecticut
24.0 (18.7-29.4)
26.6 (22.4-30.9)
32.5 (27.0-38.0)
34.3 (30.1-38.6)
Delaware
31.5 (26.8-36.3)
35.9 (29.1-42.6)
Georgia
24.6 (19.9-29.2)
31.5 (25.3-37.8)
Hawaii
23.6 (19.7-27.5)
20.5 (16.9-24.1)
Indiana
22.2 (19.0-25.5)
Maine
20.4 (15.6-25.2)
Massachusetts
29.3 (26.4-32.2)
33.2 (29.3-37.2)
40.2 (36.3-44.2)
43.4 (39.0-47.8)
Minnesota
29.8 (27.2-32.4)
Mississippi
15.7 (12.1-19.3)
Missouri
26.5(21.7-31.3)
28.5 (22.9-34.2)
Nebraska
25.4 (22.1-28.7)
North Carolina
27.9 (23.7-32.0)
Rhode Island
36.4 (30.9-41.9)
41.2 (35.5-46.8)
South Carolina
24.0 (20.6-27.4)
23.2 (19.6-26.7)
South Dakota
25.2 (19.5-30.8)
Tennessee
10.9 (5.2-16.5)
Texas
11.6 (8.5-14.7)
18.6 (14.4-22.7)
West Virginia
16.4 (12.8-20.1)
31.3 (27.3-35.4)
Wisconsin
17.5 (12.4-22.6)
Wyoming
23.4 (16.7-30.0)
immunization (43.4%). In 2016, nine states completed the HPV module (Alabama, Connecticut, Hawaii, Missouri, Nebraska, North Carolina, South Carolina, South Dakota, and Texas). 23.8% of the overall respondents had received an HPV vaccine in 2016, with Connecticut leading HPV immunization (34.3%).
On analyses by selected characteristics
for each of the study years (Table 2; ��������� ��������� ��� � ������ ��� provided in Table 2 for each year), HPV vaccination coverage was found to be ������������ ����� �� ������ ��� ���� difference was consistent across all study years. Having health insurance and having � �������� ������ ���� ������������
associated with higher prevalence of
HPV vaccination. Being unmarried was ����� �� �� ������������ ���������� ���� � higher prevalence of HPV vaccination for some years.
�� ���������� ����������� ��� ����� ��
race, education, income, and receiving an HIV test (Table 2).
Initiation of HPV vaccination among females aged 18-29 years For the combined data (2013-2016),
a total of 9,142 women answered
HPV vaccination questions in the BRFSS survey. Overall, 4,199 (44.7%) women ever had an HPV vaccination. The initiation of HPV vaccination
among women differed by selected
���������������� ���������� �����������
in HPV initiation were found by race, education, income, insurance, MSA status, marital status, having a personal doctor, and having received an HIV test (Table 3). By race, the prevalence of HPV initiation was lower among blacks (39.6%) and Hispanics (33.4%) as compared to white females (51.1%, p<.0001). HPV vaccination was lower among women living in non-MSA areas (35%, p=.0068), women who were single (32.2%) or in
a (married or other) couple relationship (36.8%, p<.0001), women with less than high school education (36%, p<.0001), women with a lower income (41%, p<.0001), and uninsured women (30.4%,
Del Med J | January/February 2019 | Vol. 91 | No. 1
29
