
Page 31 - Delaware Medical Journal - January/February 2019
P. 31
ORIGINAL RESEARCH
differences in HPV completion were found by race and income (Table 3). By race, the prevalence of HPV completion was lower among blacks (21%) and Hispanics (22%) as compared to white males (34.1%, p=.03). Men with a lower income (25.8%) had a lower prevalence of HPV completion as compared to higher income (39.4%, p=.0087).
DISCUSSION
HP2020 targets 80% HPV vaccine coverage (three doses) for males and females by age 13 to 15 years.6 In this study covering the years 2011 to 2016, coverage for both males and females was well below this target.
Single
≤High school
College graduate or above
<25,000
25,000- <50,000
≥ 50,000
Yes No
Yes
No
*P <0.05
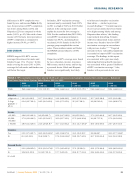
In females, HPV vaccination coverage increased nearly consistently from 32.8% in 2011 to a high of 51.4% in 2015. Further analyses in the coming years could explain the reason for low coverage in 2016. For the combined data (2013-2016), overall HPV vaccination initiation in females was 44.7%, and among those vaccinated, 60.1% females in the 18-29- year age group completed the vaccine series. These numbers remain well below the HP2020 national objective of 80% completion.
Disparities in HPV coverage were found by race, education, income, insurance, MSA status, marital status, and having a personal doctor. Black and Hispanic ������� ���� ������������ ���� ������
to initiate and complete vaccination than whites — similar to previous �������� ��������13, 14 Considering rates of cervical carcinoma have been found to be higher among blacks and among Hispanics than whites,1 ���� ������
is particularly disturbing. Females
with lower educational status and low income were found to have low HPV vaccination coverage in concordance with previous studies.7, 13, 14 Targeted outreach to these vulnerable populations is essential to improve HPV vaccination ��������� ��� ������� �� ���� ������
are consistent with a previous study indicating that having health insurance was associated with a greater likelihood of HPV vaccination coverage.15 Also, females with a personal doctor were
Data suppressed
25.5 (23.1-28)* 33.2 (28.8-37.5)
26.7 (22.5-30.9) 27.2 (22.9-31.6)
29.7 (25.5-33.9)
30.3 (27.7-32.8)* 16.2 (12.2-19.9)
30.6 (28.0-33.2)* 21.6 (17.9-25.4)
TABLE 2. HPV vaccination (≥ 1 dose) among 18-29 years old, by socio-demographic characteristics and by year — Behavioral Risk Factor Surveillance System, United States, 2011 to 2016
Income
2011
% (95%CI)
2012
% (95%CI)
2013
% (95%CI)
2014
% (95%CI)
2015
% (95%CI)
2016
% (95%CI)
Education
Data suppressed
10.2 (4.4-16)
Data suppressed
21.6 (14.1-29.1) *
Data suppressed
14.3 (9.2-19.5)
15.7 (13.4-18.1)*
31.6 (28.8-34.5)
29.5 (27.5-31.6)*
35.7 (32.5-38.9)
21.4 (16.7-26.1)
24.5 (22.3-26.9)
31.2 (27.3-35.1)
35 (31.7-38.3)
39 (34.5-43.6)
19.8 (13.3-26.3)
18 (15.4-20.7)
25.6 (21.7-29.5)*
29 (25.5-32.6)
37.1 (31.3-42.9)
17.9 (11.2-24.5)
19.3 (15.9-22.7)
30.9 (25.7-36.1)
27.5 (24.2-30.8)
32 (26.7-37.4)
Insurance
18.9 (11.3-26.6)
23.4 (20-26.8) *
35.7 (31.3-40.2)
35.1 (31.7-38.4)*
40.5 (35.4-45.6)
21.5 (17.3-25.7)
24.5 (22.5-26.5)*
34.5 (31.8-37.2)
33.1 (31.1-35)*
39 (36-42)*
8.3 (3.5-13.1)
11.8 (9-14.7)
17.6 (12.6-22.6)*
19.9 (15.7-24.1)
26.7 (19.9-33.4)
Personal Doctor
21.2 (16.8-25.6)
25.6 (23.3-27.8)*
37.3 (34.3-40.3)*
37.3 (35-39.6)*
41.1 (37.6-44.4)
10.8 (6.1-15.5)
13 (10.7-15.3)
17.7 (14.5-21)
20.4 (17.7-23.2)
29.2 (24.4-33.6)
Del Med J | January/February 2019 | Vol. 91 | No. 1
31
