
Page 34 - Delaware Medical Journal - January/February 2021
P. 34
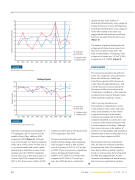
FIGURE 4
Mechanical thrombectomy
���������� ���� �� ��� ������ ��
mechanical thrombectomy cases compared to June 2019; however, June 2019 had more mechanical thrombectomy cases compared to the other months of the same year, suggesting that this particular month may have been an outlier from the prior years. (Figure 4).
The number of patients discharged with
a diagnosis of stroke also decreased over the course of April to June 2020. The daily average number of discharges with a diagnosis of stroke was 3.67 in FY 2019, compared to 3.31 in 2020. (Figure 5).
DISCUSSION
The coronavirus pandemic has affected stroke care worldwide, across the United States and in Delaware. Initial data
from China reported a 40% decrease in stroke-related hospital admissions,3 and
a similar decrease has been reported by the American Heart Association in the United States3 and Brazil: a 36% reduction in admission for transient ischemic attack (TIA) and mild to moderate strokes.4
After reviewing our data across ChristianaCare (comprehensive stroke center, primary stroke center, and acute stroke-ready hospital), we have found
� ���������� �������� �� ��� ������
of patients presenting with stroke-like �������� ��������� �� � ������ ������ ���
a decrease in the number of patients with
a stroke diagnosis at discharge. Although there was no decrease in the number of patients receiving alteplase and mechanical thrombectomy in April or May, there was a decrease in June compared to 2019.
Based on known historic institutional data, the observed reduction in patients presenting with stroke-like symptoms is more than would be typically expected based on variation alone. Reviewing April and May data suggested that, because treatment with mechanical thrombectomy ��� ��� �������� ������������� ��������
FIGURE 5
Stroke discharge diagnosis
utilization of emergent neuroimaging CT, CT angiogram, and CT perfusion in the months of April, May, and June 2020, compared to 2019 (Figure 3). Although some of the studies were done for inpatient stroke alerts, which can be variable, this is a very minor number and cannot explain the big drop in utilization of acute stroke imaging since the COVID-19 pandemic started. There was a 42% drop in total CT scans in April 2020, compared to April 2019; a 31% drop in scans in May of 2020
compared to 2019; and an 18% drop in June 2020 compared to June 2019.
The mean mechanical thrombectomy numbers did not change when comparing daily averages in April or May of either year (0.34 per day in 2019 vs. 0.37 per day �� ������ ����� ���� �������� � ���������� drop in mechanical thrombectomy numbers in FY 2020 (0.3 events per day) compared to FY 2019 (0.53 events per day). June 2020 did show a statistically
34
Del Med J | January/February 2021 | Vol. 93 | No. 1
