
Page 33 - Delaware Medical Journal - January/February 2021
P. 33
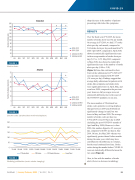
FIGURE 1
Stroke alerts
sharp decrease in the number of patients presenting with stroke-like symptoms.
RESULTS
���� ��� ����� ���� ���� ����� ��� ����
number of stroke alerts was 162 per month. On average in FY 2019, we had 5.37 stroke alerts per day each month, compared to 5.04 stroke alerts per day each month in FY 2020. April 2019, compared to April 2020, ������ � ������������� ���������� �������� in the average number of stroke alerts per day (5.67 vs. 3.27). May 2019, compared
to May 2020, also showed a statistically
���������� �������� �� ��� ������ �� ������
alerts per day (5.48 vs. 3.81)
(Figure 1). June data continued to show fewer stroke admissions for FY 2020 (2.37 cases per day) compared with FY 2019 (3.8 cases per day). Findings suggest that average daily admissions for patients with stroke-like symptoms and stroke alerts ���� ������������ ����� �� ������ ���� ��� even June 2020, compared to the previous year; however, daily averages were not statistically different prior to the onset of the COVID-19 pandemic in our area.
The mean number of ChristianaCare stroke codes (patients receiving alteplase therapy) between 2019 and 2020 did not ������������ ������ �� ������ ��� ��� lower in May and June 2020. The average number of stroke codes per day was
0.74 in 2019 versus 0.64 per day in 2020 (including the post-COVID-19 months of April and May 2020). However, in June 2020, this number dipped to 0.5 cases per day, compared with 0.87 per day in June 2019. Of note, the May 2019 volume was ������������ ������� ���� ��� ����� ������ during the same year, which may have contributed to the difference in volumes, but the trend continued into June. Stroke codes during the months before COVID-19 were not statistically different between the two years (Figure 2).
Also, in line with the number of stroke alerts, there is a decrease in radiology
FIGURE 2
Stroke codes (strokes that received alteplase)
FIGURE 3
Radiology utilization (acute stroke imaging)
Del Med J | January/February 2021 | Vol. 93 | No. 1
33
COVID-19
