Page 17 - Georgia Forestry - Fall 2018
P. 17

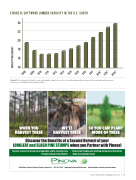
FIGURE B: SOFTWOOD LUMBER CAPACITY IN THE U.S. SOUTH
 24 22 20
18 16 14
Figure B: Note: capacity totals reflect a year-end snapshot; estimates for 2018-2020 include announced projects expected to come online in the given year. Source: Q 3 2018 Forisk Research Quarterly (FRQ)
                                                                                                                                                                                                                                                                                                                                                                                                                                         www.GeorgiaForestryMagazine.com | 15
Capacity (Billion BF)
2008
2009
2010
2011
2012
2013
2014
2015 2016
2017
2018* 2019*
2020*


   15   16   17   18   19