
Page 16 - Georgia Forestry - Fall 2018
P. 16
“People mistake forest investments as allocating capital to trees when you’re really betting on the work, needs and preferences of people.” — Brooks Mendell, Ph.D.
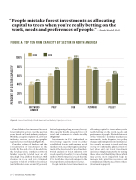
FIGURE A: TOP TEN FIRM CAPACITY BY SECTOR IN NORTH AMERICA
100%
80%
60% 40%
20%
2008 2018
100%
47%
40%
59%
95%
75%
73%
73%
45%
65%
0%
LUMBER
OSB
Figure A. Source: Forisk Study of North American Forest Industry Capacity, 2008-2020
PLYWOOD
PELLET
Consolidation has increased in most forest industry sectors over the past ten years based on Forisk industry analysis. With the exception of plywood, all forest industry sectors across geographic regions have consolidated (Figure A).
Consider softwood lumber and the concentration of investment in the South. By the end of 2008, headed into the housing crisis, southern softwood lumber capacity totaled near an all- time high of 19.5 billion board feet. Mill closures in 2009 and 2010 trimmed capacity to below 17 billion board feet (and utilization rates around 67 percent)
before beginning a long recovery. In 2017, this capacity finally exceeded its 2008 total and continues to climb steadily (Figure B).
Investments in U.S. timberland or wood-using capacity occur in either established forests with mature wood markets or in areas that require develop- ment of the forests and/or wood markets. Forisk analysis of forest industry soft- wood capacity of nearly 1,700 wood-using mills in North America reveals that the U.S. South has clear advantages in the forest products end markets it serves.
People mistake forest investments as
allocating capital to trees when you’re really betting on the work, needs and preferences of people. We find that most of the “frictions” in timber markets are man-made: trade disputes, tax policy changes and immigration inconsistencies. As a result, we want to track and stay on top of confirmable physical facts to test ideas and our forest investment decisions. Simple frameworks for testing these ideas and identifying those which may prove most impactful help us manage risk, prioritize resources and communicate what we need from others. (Continued on page 16)
14 | GEORGIA FORESTRY
SOFTwood PULP
Percent of sector capacity
