
Page 36 - Delaware Medical Journal - March/April 2021
P. 36
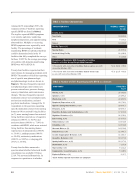
TABLE 1: Facilities Characteristics
CHARACTERISTICS
OVERALL SAMPLE (N=38)
County, n (%)
14.4 (14.0-14.7)
New Castle
19 (50.0)
Kent
5 (13.2)
Sussex
14 (36.8)
Facility Type, n (%)
Nursing Home
21 (55.3)
Assisted Living Facility
11 (28.9)
Other
6 (15.8)
Prevalence of Residents With Dementia in Facilities That Do or Do Not Accept People With Dementia
% Residents with dementia in facilities that accept people with dementia (Median, IQR)
52.2 (38.4 - 69.0)
% Residents with dementia in facilities that do not accept people with dementia (Median, IQR)
47.3 (23.5 - 60.0)
Among the 38 responding LTCFs, the responses of the 27 facilities reporting ������� ���� ��� ������ �� Table 2.
��� ��� ��� �������� ���� �������� were anxiety, agitation, wandering, dysphoria/depression, and appetite/eating abnormalities. Multiple co-occurring BPSD symptoms were reported by each facility. The percentage of residents manifesting BPSD in individual facilities could be determined only in the 19 facilities that fully completed the surveys. In those 19 LTCFs, the average percentage of residents with dementia manifesting BPSD was 49.3% (SD 28.9).
Twenty-four facilities reported on their interventions for managing residents with BPSD. The numbers of facilities reporting ��� �� ������� �����������������
and pharmacologic tools are shown in Figure 1. The most frequently reported non-pharmacologic interventions are person centered care, presence therapy, sensory stimulation, and reminiscence therapy. The most frequently reported medication classes were antidepressants, anti-anxiety medications, and anti- psychotic medications. Amongst the 19 respondents to the questions regarding ������� ���������� ������� ���� ������� homes (n=10) or assisted living facilities (n=7), more nursing homes than assisted living facilities reported use of cognitive enhancers (100.0% vs. 42.9%) and anticonvulsants (100.0% vs. 71.4%) in residents with BPSD, while more assisted living facilities than nursing homes reported use of antipsychotics (100.0% vs. 30.0% ), antidepressants (100.0%
vs. 90.0%), antianxiety medications (100.0% vs. 80.0%), or sleeping pills (57.1% vs. 50.0%).
Twenty-four facilities answered a question about whether behavioral health consultation was available. Of these,
�� ������� �������� ������������� �� response to a question as to whether
TABLE 2: Number of LTCFs Reporting Specific BPSD as a Concern
SYMPTOMS*
FACILITIES N=27
Anxiety, n (%)
25 (92.6)
Agitation, n (%)
23 (85.2)
Wandering, n (%)
22 (81.5)
Dysphoria/Depression, n (%)
20 (74.1)
Appetite/Eating Abnormalities, n (%)
18 (66.7)
Delusions, n (%)
18 (66.7)
Repetitive Behavior and Verbalizations, n (%)
17 (63.0)
Nighttime Behavior, n (%)
16 (59.2)
Exit-Seeking, n (%)
15 (55.5)
Hallucinations, n (%)
14 (51.8)
Irritability, n (%)
14 (51.8)
Aberrant Motor, n (%)
14 (51.8)
Intrusiveness, n (%)
11 (40.7)
Socially Inappropriate Behavior, n (%)
11 (40.7)
Assaultive Behavior, n (%)
10 (37.0)
Apathy/Indifference, n (%)
10 (37.0)
Disinhibition, n (%)
7 (25.9)
Hyperorality, n (%)
6 (22.2)
Inappropriate Sexual Behaviors, n (%)
5 (18.5)
Euphoria/Elation, n (%)
1 (3.7)
*Each facility reported more than one symptom
84 Del Med J | March/April 2021 | Vol. 93 | No. 2
