
Page 23 - Delaware Lawyer - Spring 2019
P. 23
as in Wilmington’s case. At the same time, limited transit schedules make it difficult for workers during daily commutes and can ultimately hinder an employer’s abil- ity to attract talent if not properly scaled. A Significant Challenge:
Labor Supply
However, being situated in the North- east corridor presents a number of chal- lenges, the first being labor supply. Wilm- ington is directly competing with larger cities like Philadelphia, Washington and New York for skilled labor. Employers based in larger cities attract a greater quantity of high-quality candidates. This is simply because these locations have ac- cess to a larger population and salaries tend to be higher. On the flip side, em- ployers are less likely to move to satellite cities unless there is an educated, creden- tialed or skilled workforce that can feed their pipeline of potential employees. A low-skilled workforce leads to an inability to attract companies, which leads to an in- ability to attract new talent, which further feeds the vicious cycle of disinvestment.
Since the end of the recent reces- sion, Wilmington has seen a slow but steady pattern of growth. Unemploy- ment dropped to 5.1 percent in late 2018, but it is still high by historical standards. In addition, the city has witnessed a shrinkage of skilled labor in recent years.
A key challenge in the downtown business district is to retrofit previous spaces to better match the needs of new businesses and retail establishments.
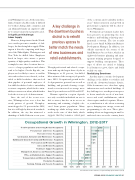
Though professional and related occupa- tions make up the largest share of jobs in Wilmington at 23 percent, low-skilled labor witnessed the strongest job growth since 2012. Occupational growth in the food preparation, personal care as well as building- and grounds-cleaning occupa- tional sectors increased on average more than 16 percent between 2012 and 2017.
Human capital in a region depends not only on which individuals an area is able to attract, but also on its success in nurturing and retaining a highly edu- cated home-grown population. Many working-age adults in large metro areas reside in the state of their birth, which suggests that they remain a critical part
of the economic and social fabric in these areas.3 Talent attraction and growth in professional occupations will be a key is- sue in Wilmington.
Fortunately, government leaders have been proactive in promoting the local workforce and building a thriving entre- preneurial ecosystem. The city recently hired a new Small & Minority Business Development Manager. In addition, city officials announced the return of the Small Business Success Series, which is an eight-week business planning and man- agement training program designed to support budding entrepreneurs. These types of efforts are critical to helping local businesses grow, thrive and build wealth over time.
Revitalizing Downtown
Another major economic development challenge is the ability to revitalize and retrofit the downtown business district. Older downtown cores often have aging infrastructure and outdated buildings. A key challenge is to retrofit previous spaces to better match the needs of new busi- nesses and retail establishments, which often require smaller footprints. Howev- er, revitalization is also about activating spaces, bringing new energy, events and programming to the area. These place- making efforts are happening in small to mid-sized cities across the country, but it
Occupational Growth in Wilmington, 2012-2017
Food Preparation and Serving Related Occupations Personal Care and Service Occupations Protective Service Occupations Construction, Extraction and Maintenance Occupations Building and Grounds Cleaning and Maintenance Ocupations Professional and Related Occupations Sales and Related Occupations Healthcare Support Occupations Management, Business and Financial Occupations Office and Administrative Support Occupations Transportation and Material Moving Occupations Production Occupations Farming, Fishing, and Forestry Occupations
29%
19%
11%
11%
2%
2%
0%
-4%
-9%
-12%
-16%
-33%
-35%
-40% -30% -20% -10% 0% 10% 20% 30% 40%
Source: Bureau of Labor Statistics, Occupational Employment Statistics (2018)
SPRING 2019 DELAWARE LAWYER 21
