
Page 18 - Delaware Medical Journal - November/December 2020
P. 18
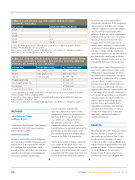
TABLE 2-1: AGE-SPECIFIC ALL-SITE CANCER MORTALITY RATES; DELAWARE, 2011-2015
Age at Death
MALE AND FEMALE, ALL RACES
15-19
--
20-24
--
25-29
--
30-34
8.5
35-39
16.4
Source: Delaware Department of Health and Social Services, Division of Public Health, Delaware Health Statistics Center, 2018.
Rates are per 100,000 of population age-adjusted to the 2000 U.S. standard population. Rates based on less than 25 cases are not shown.
by which two cancer rates differ is
������������� ����������� �� ��� ���������
interval for one rate does not overlap
���� ��� ��������� �������� ��� ������� ����� ��� ��� ����� ��� ������������ ���������� ���� ��� ���� �� ������������ different from another rate, we assume that the difference between the rates
is larger than would be expected by chance alone, meaning it is statistically ����������� �� ��� ��������� �������� ��� ��� ���� �������� ���� ��� ��������� interval for another rate, the two rates are ��� ������������� ������������ ���������� and this is commonly referred to as “no meaningful difference” between rates.
For this report, cancer frequencies and rates were suppressed according to the DPH’s Policy Memorandum 49 (Data
and Data Release Standards): Incidence and mortality frequencies of 10 or fewer were not shown, in order to protect ������� ������� ��� ��������������� �� some instances, additional cells were suppressed so that one cannot deduce the actual count in the initially suppressed cell. Suppressing incidence and mortality statistics based on a small number of cancer cases or deaths helps protect ������� ������� ��� ���������������13 Age-adjusted incidence and mortality rates based on fewer than 25 cases or deaths were suppressed, as they are inherently unstable and cannot be reliably interpreted.
RESULTS
Based on the 2011-2015 Delaware Cancer Registry Incidence Report for AYAs,
the results are as follows: New Castle had the greatest incidence of cancer compared to other counties (Table 1-1), females had an approximately two times greater incidence of cancer compared
to males (Figure 1-1), consisting mostly of non-Hispanic Caucasians and African Americans (Figure 1-1),
TABLE 2-2: AVERAGE ANNUAL AGE-ADJUSTED CANCER INCIDENCE RATES WITH 95% CONFIDENCE INTERVALS, NON-HISPANIC AFRICAN-AMERICAN FEMALES; DELAWARE VS. U.S., 2011-2015
CANCER SITE
DE INCIDENCE RATE
U.S. INCIDENCE RATE
All-Site
103.9 (88.9, 120.6)
76.6 (74.8, 78.5)
Breast
28.2 (20.5, 37.7)
26.5 (25.5, 27.7)
Thyroid
14.2 (9.1, 21)
9.1 (8.5, 9.8)
Hodgkin Lymphoma
--
3.1 (2.8, 3.5)
Non-Hodgkin Lymphoma
--
3.7 (3.3, 4.1)
Cervix Uteri
--
5.7 (5.2, 6.2)
Corpus and Uterus, NOS
--
3 (2.6, 3.3)
Source (Delaware): Delaware Department of Health and Social Services, Division of Public Health, Delaware Cancer Registry, 2018.
Source (U.S.): Surveillance, Epidemiology and End Results Program (SEER 18), National Cancer Institute, Nov 2017 sub.
Rates are per 100,000 of population age-adjusted to the 2000 U.S. standard population.
METHODS
AYA Delaware Cancer Incidence Report
Upon request, the Delaware Cancer Registry recreated the 2011-2015 Cancer Incidence ������ ������� �� �����12
Statistical Analysis
Incidence and mortality rates for Delaware are expressed per 100,000 Delawareans, and rates for the U.S. are expressed per 100,000 U.S. residents. Due to Delaware’s small population base, cancer rates were calculated ����� �������� �������� ���� ��������� ��� both cancer incidence and mortality.
Cancer incidence and mortality
rates were adjusted by age to enable comparisons between populations that may have different age distributions (e.g., Delaware vs. the U.S.). Thus, age-adjusted cancer rates can be compared without any concern about how differences in age distribution of the populations would affect cancer rates. The standard population used to adjust for age is the 2000 U.S. population.
���������� ������� ��������� ���������
were computed for each cancer rate.
��������� ��������� ��������� ��� �����
of values in which the cancer rate could reasonably fall 95% of the time. They are used to determine whether the amount
258
Del Med J | November/December 2020 | Vol. 92 | No. 6
