
Page 14 - Delaware Medical Journal - February 2018
P. 14
SCIENTIFIC ARTICLE
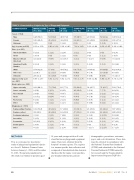
TABLE 1. Characteristics CHARACTERISTIC
Sex (n = 664) Male
Female
Unknown
Age in years (n=666) Race (n = 666)
American Indian Asian
Black or African American
Hawaiian/Pacific Islander
White Other race Unknown
Injury severity score (n = 657)
Body region (n = 666) Upper extremity Lower extremity Face/mouth
Head Neck/torso Other
Diagnosis (n = 666) Supracondylar fracture Fracture (other) Contusion/abrasion Laceration
Concussion Strain/sprain Other
METHODS
of Injuries by Type of Playground Equipment
MONKEY BARS (N = 253)
128 (50.6) 125 (49.4) 0 (0)
6.19 ± 1.90
5 (2.0)
1 (0.4) 32 (12.6)
6 (2.4)
159 (62.8) 22 (8.7)
28 (11.1) 6.05 ± 2.67
223 (88.1) 2 (0.8)
2 (0.8)
13 (5.1)
6 (2.4) 7 (2.8)
131 (51.8) 99 (39.1) 3 (1.2)
5 (2.0)
10 (4.0) 1 (0.4) 4 (1.5)
SWINGS (N = 95)
54 (56.8) 41 (43.2)
0 (0)
6.89 ± 3.34
1 (1.1) 0 (0)
9 (9.5)
2 (2.1)
57 (60)
11 (11.5) 15 (15.8) 5.51 ± 2.72
73 (76.8) 6 (6.3)
4 (4.2)
8 (8.4)
1 (1.1) 3 (3.2)
40 (42.1) 42 (44.2) 3 (3.1)
1 (1.1)
6 (6.3) 1 (1.1) 2 (2.1)
SLIDES (N = 83)
48 (57.8) 34 (41.0)
1 (1.2)
5.39 ± 2.83
2 (2.4)
1 (1.2) 13 (15.7)
1 (1.2)
49 (59.1)
8 (9.6)
9 (10.8) 5.62 ± 2.71
64 (77.1) 8 (9.5)
4 (4.7)
4 (4.7)
2 (2.3) 1 (1.7)
37 (44.6) 34 (41.0) 7 (8.4)
1 (1.2)
2 (2.4) 0 (0)
2 (2.4)
TRAMPOLINE (N = 91)
35 (38.5) 56 (61.5)
0 (0)
7.92 ± 3.83
1 (1.1) 0 (0)
3 (3.3)
1 (1.1)
69 (75.8)
8 (8.8)
9 (9.9)
5.51 ± 2.76
59 (64.8) 18 (19.8) 1 (1.1)
4 (4.4)
8 (8.8) 1 (1.1)
33 (36.3) 47 (51.6) 2 (2.2)
1 (1.1)
5 (5.5) 3 (3.3) 0 (0)
JUNGLE GYM (N = 51)
26 (51.0) 25 (49.0)
0 (0)
5.61 ± 2.84
0 (0)
0 (0)
7 (13.7)
1 (2.0)
34 (66.6)
4 (7.8)
5 (9.8)
5.06 ± 2.82
34 (66.7) 3 (5.9)
2 (3.9)
4 (7.8)
3 (5.9) 5 (9.8)
23 (45.1) 15 (29.4)
OTHER (N = 93)
TOTAL
(N = 666)
349 (52.4) 315 (47.3) 2 (0.3)
6.36 ± 2.84
9 (1.4)
3 (0.5) 73 (11.0)
12 (1.8)
432 (64.9) 63 (9.5)
71 (10.7) 5.74 ± 2.70
529 (79.4) 44 (6.6) 15 (2.2) 36 (5.4) 21 (3.2) 21 (3.2)
307 (46.1) 280 (42.0) 19 (2.8) 10 (1.5) 27 (4.1)
6 (1.0) 17 (2.5)
58 (62.4) 34 (36.6) 1 (1.0) 6.00 ±
0 (0)
1 (1.1) 9 (9.6)
1 (1.1)
64 (68.8) 10 (10.8)
8 (8.6)
5.84 ± 2.57
76 (81.7) 7 (7.5)
2 (2.2)
3 (3.2)
1 (1.1) 4 (4.3)
43 (46.2) 43 (46.2) 2 (2.15) 1 (1.1)
1 (1.1) 1 (1.1) 2 (2.15)
2.65
2 1 3 0 7
(3.9) (2.0) (5.9) (0) (13.7)
This is a retrospective descriptive
study of playground equipment injuries at a Level 1 Pediatric Trauma Center between January 1, 2009, and December 31, 2016. The patient population for
this study was limited to patients aged
18 years and younger with an E-code
��������������������������������������
injury. Data were obtained from the hospital’s trauma registry. The registry ����������������������������������������� composed of standardized data elements ����������������������������������������� pre-hospital information, patient
demographics, procedures, outcomes, payer, and cost information. These data must be collected in compliance with the National Trauma Data Standard (NTDS) and submitted to the National Trauma Databank (NTDB) annually for research and the Trauma Quality Improvement Program (TQIP) for
46
Del Med J | February 2018 | Vol. 90 | No. 2
